20 APR 2026 · 15 MIN READ
designing instagram's hashtag page
a system that looks deceptively simple on the surface but hides a bunch of interesting engineering decisions underneath. you know the page — when you tap #sunset on instagram and see the name, total posts, and a grid of top photos. let's walk through how to actually build it.
what you'll take away
quick pointers so you know what to look for as you read:
- a guiding principle saves you from the cap theorem. "best user experience" wins ties so you stop fighting consistency vs availability vs latency.
- store just enough, not everything. the gray area between "ID only" and "full metadata" is where the system gets cheap and simple.
- pagination isn't always an optimization. sometimes it's just disk I/O dressed in a useful-looking flag.
- kafka isn't infra you bolt on, it's the natural answer when many services care about one event. post service shouldn't know who's listening.
- two-buffer swap beats stop-the-world. the critical section becomes a pointer flip — three CPU instructions.
the requirement
imagine you're an early engineer at instagram and someone walks up to you and says — "hey, we need to build this page." for every hashtag, all you have to show is:
- the name of the hashtag
- total number of posts (approximate is fine)
- top 100 photos tagged with it
the top 100 photos? that's computed by a data science team. you don't care about their logic — exponential decay, reaction counts in the last hour, whatever. they hand you a list of 100 post IDs. your job is to render the page. sounds simple right? well, the moment you dig in, you realize there's so much more.
design principle: best user experience
before we start, here's a discipline that most engineers skip — define your guiding principle. for this system, it's best user experience. every single design decision should optimize for UX. whenever you're stuck between option A and option B, you pick the one that makes the user's experience better.
this is honestly one of the best habits you can build. without a guiding principle, you end up in the classic trap where someone says "i want strong consistency, high availability, AND fault tolerance" and you're basically violating the CAP theorem. you can't have it all. but what you're okay giving up on should depend on what you're optimizing for.
✽ RECALL you're stuck between two designs and someone wants strong consistency, high availability, AND low latency all at once. how does a guiding principle get you unstuck?
you can't have it all — that's the cap theorem trap. declaring a principle up front ("best user experience" here) gives you a tie-breaker: every contested decision gets resolved by asking which option serves the principle, so you know in advance what you're willing to give up instead of re-fighting the same tradeoff on every choice.
the read path
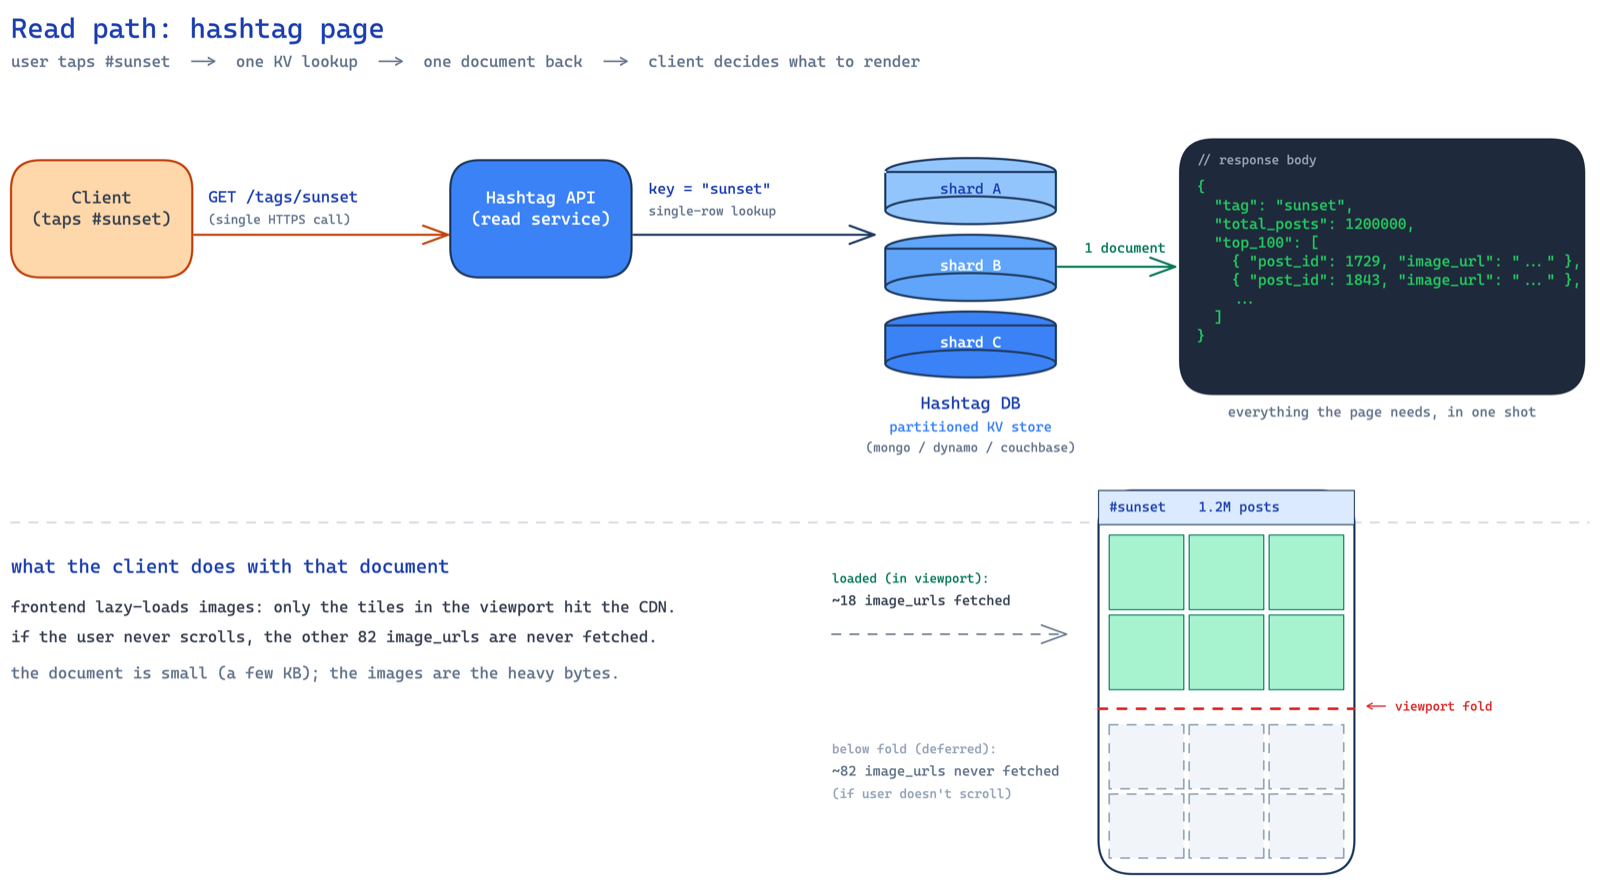
so the user taps #sunset. a GET /tags/{tag_name} request hits your hashtag API servers. and because we're optimizing for UX, this one API call should return everything — the name, the count, and the top 100 photos. no fan-out from the frontend making three separate calls. one request, one response, done.
the hashtag db is a partitioned key-value store — could be mongodb, dynamodb, whatever. but why partitioned? because our access pattern is dead simple — given a hashtag name, fetch its document. that's a key-value lookup. the hashtag name (like sunset) is the key, the document with count and top photos is the value. no range queries, no joins, no fancy relational stuff. just get(key) → value.
and because there are millions of hashtags, one machine can't hold all of them. you need to spread the data across multiple nodes. the hashtag name is a natural partition key — it distributes well (hashtags are diverse enough), and all the data you need for one hashtag lives in a single document on a single node. no cross-partition queries needed. so the three requirements from storage are: partitioned, key-value access, and durable. mongodb, dynamodb, couchbase — any of these work. pick based on team expertise and operational comfort.
the document looks something like this:
{
  "tag": "sunset",
  "total_posts": 1200000,
  "top_100": [ ... ]
}
now the interesting question — what goes inside top_100?
storing top 100: the storage tradeoff
you have three options here and this is where things get spicy. let's do the math for each so we make an informed decision instead of going with gut feel.
option 1: store only post IDs. so top_100 is just [p1, p2, p3, ..., p100]. let's break down the document size:
tag name:       ~12 bytes (avg hashtag length)
total_posts:    ~32 bytes (number serialized as string + key overhead)
top_100 array:  100 × 8 bytes (snowflake IDs are 64-bit = 8 bytes each)
                = 800 bytes
─────────────────────────────────────
total:          ~850 bytes ≈ 1 KB
cheap on storage. but now when a request comes in, you read this document, get the 100 IDs, and then you have to do a batch read from the posts database to fetch the actual post details — image URLs, captions, whatever you need to render the grid. that's a second lookup. more latency. bad for UX.
option 2: store entire post metadata. so you denormalize everything — caption, image URL, user details, tags, the works. per post:
post ID:        8 bytes   (snowflake)
caption:        ~160 bytes (avg caption with hashtags baked in,
                           think twitter-length text)
image URL:      ~160 bytes (CDN URLs can be long)
user metadata:  ~160 bytes (username, profile pic URL, etc.)
─────────────────────────────────────
per post:       ~488 bytes, but captions contain hashtags
                which eat space, so realistically ~560-660 bytes
                let's call it ~1 KB conservatively

top_100 array:  100 × ~1 KB = ~100 KB per document
that's ~100 KB read from disk on every lookup. and here's the nastier problem — if you store likes count here, every time a like happens, you have to update it in the posts db AND here. you just introduced a consistency nightmare and extra plumbing to keep things in sync.
option 3: the middle ground. this is where you put on the product manager hat. you ask yourself — what's the bare minimum we need to render the grid? just the photo. that's it. the user sees a grid of images. they tap one, they go to the full post page. no caption, no likes, no username on the grid view. so all you store is the post ID and the image URL:
post ID:        8 bytes   (snowflake)
image URL:      ~160 bytes
─────────────────────────────────────
per post:       ~168 bytes

top_100 array:  100 × 168 = ~16,800 bytes ≈ 16 KB per document
from 100 KB down to ~16 KB. peanuts. no extra consistency headaches. no syncing likes. no additional lookups. dead simple.
and here's the key insight — you as an engineering leader can propose product changes that simplify the system. most people think this is not possible. it absolutely is. if your idea has merit and optimizes the system, your PMs will get it. it's not product versus engineering — it's product AND engineering towards the same goal. the answer usually lies in the gray area.
✽ RECALL for the top-100 grid, why is storing only post IDs bad, why is storing full post metadata also bad, and what's the middle ground?
IDs alone force a second batch read against the posts db on every page view — extra latency, worse ux. full metadata balloons the document to ~100 KB per read and creates a consistency nightmare (likes now live in two places that must stay in sync). the middle: store exactly what the grid renders — post id + image url, ~16 KB, one lookup, zero sync plumbing. and noticing that the grid only needs the photo is a product change an engineer can and should propose.
why pagination is overkill here
now someone will inevitably say "shouldn't we paginate the top 100?" and at first glance it sounds reasonable. but think about how the data is stored. you have one JSON document with an array of 100 items. if you paginate with page=1&size=10, what happens? the database still reads the entire document off disk, then discards 90 entries and returns 10. that's a waste of disk I/O. you're not saving anything.
pagination makes sense when you have separate rows — like SELECT * FROM posts LIMIT 10 OFFSET 20. here, you have one document containing an array. pagination is just unnecessary overhead.
so we send all 100 post metadata (ID + image URL) to the frontend in one shot. but wait — what if the user never scrolls past the first 18 images (roughly 3 folds on a phone)? then we just wasted bandwidth loading 82 images for nothing.
lazy loading to the rescue
the trick is to offload this responsibility to the frontend. send all 100 metadata entries, but let the frontend do lazy loading of images. only fetch the actual image file when it enters the viewport. if the user never scrolls, those 82 images are never downloaded.
this is a good example of how it's not backend vs frontend — it's backend AND frontend together solving the problem. rather than over-engineering pagination on the backend, you push the intelligence to where it belongs. efficient bandwidth usage, no database overhead, great UX.
✽ RECALL why is paginating the top-100 array a fake optimization, and how do you avoid wasting bandwidth without it?
the top 100 live in one json document — the database reads the whole thing off disk regardless, then throws away 90 entries; pagination only saves work when items are separate rows. so send all 100 (id + image url) in one response and let the frontend lazy-load: an image downloads only when it enters the viewport, so a user who never scrolls past the first fold never fetches the rest.
the write path: counting hashtag posts
now we've sorted out reads. let's talk writes. every time a post is published, we need to increment the total_posts count for each hashtag in that post's caption. but before we jump to the architecture, let's build up to it.
here's what already exists in your infra. you have a post service (svc is just shorthand for service — you'll see it everywhere in system design diagrams) that handles post creation. users upload a photo, write a caption, hit publish, and the post gets stored in the posts db. that's your existing system. now you're bolting the hashtag service on top of it.
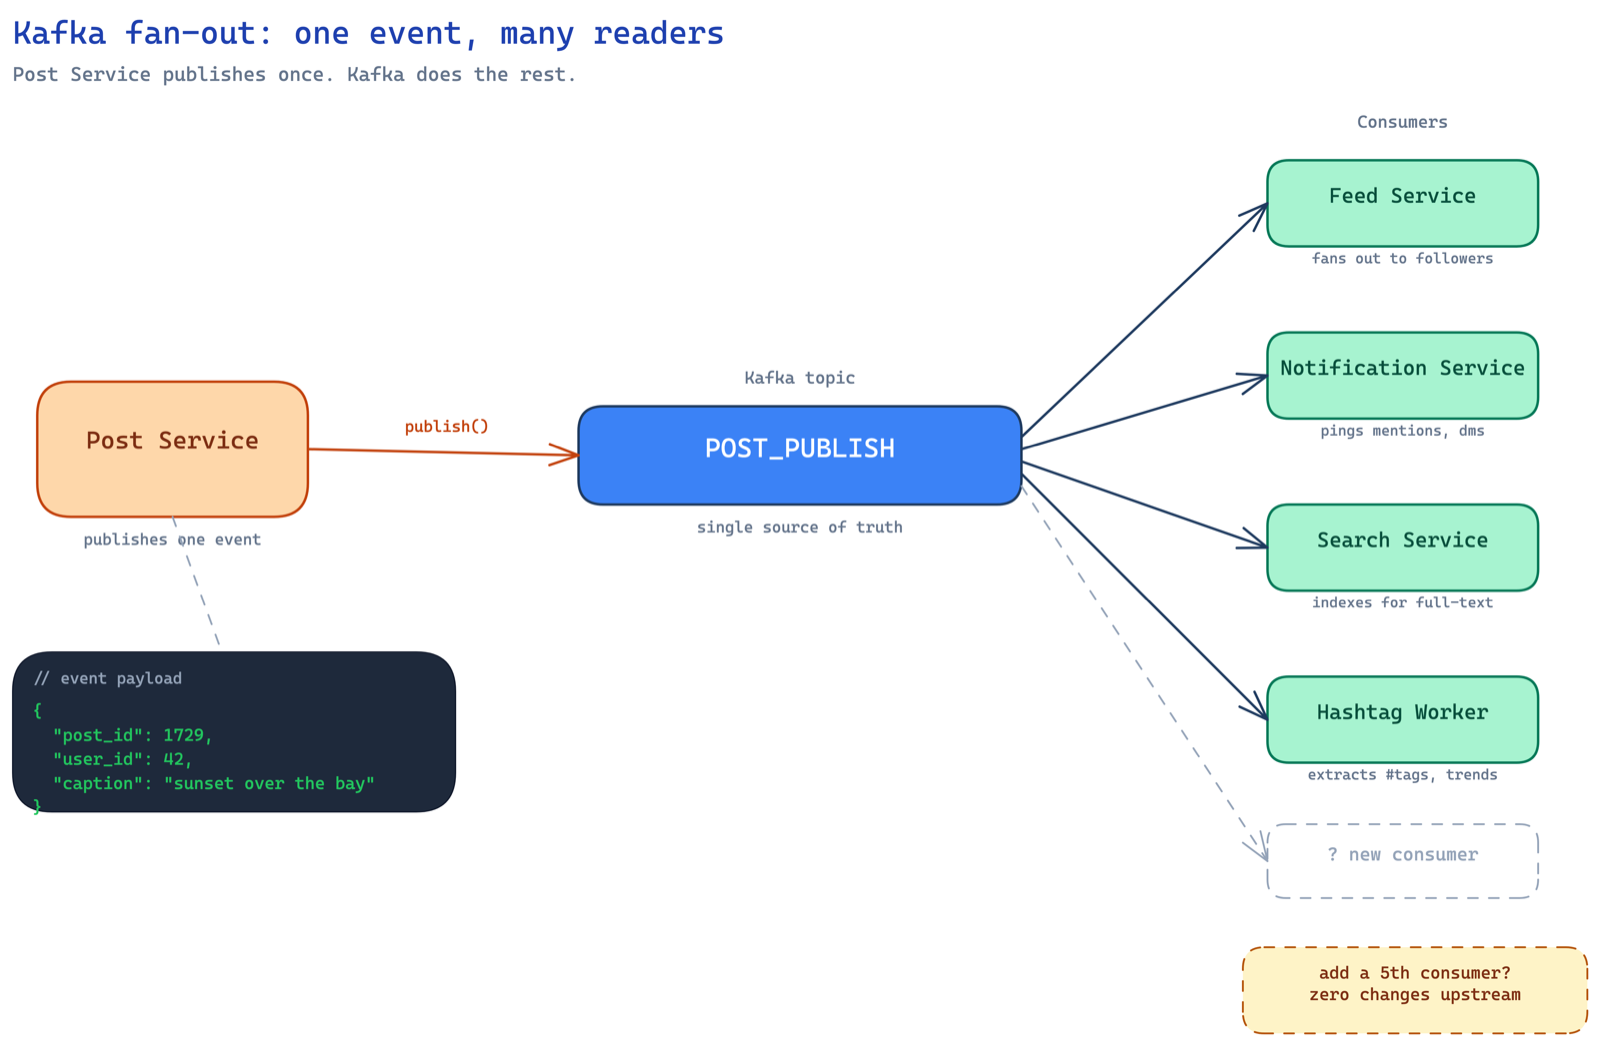
so the question is — when a post gets published, how does the hashtag service know about it? the naive thought is "just call the hashtag service directly from the post service." but think about who else cares when a post is published:
- the feed service needs to add it to followers' feeds
- the notification service needs to notify followers
- the search service needs to index it in elasticsearch
- the hashtag service needs to update counts
if the post service directly calls each of these, you've tightly coupled everything. post service now needs to know about every downstream consumer. add a new consumer? modify the post service. one downstream is slow? post service slows down. one downstream is down? post service either fails or needs retry logic for each. that's a mess.
this is the classic case for event-driven architecture with kafka as the glue. the post service doesn't care who's listening. it just publishes a POST_PUBLISH event to a kafka topic and moves on. whoever is interested — feed, notifications, search, hashtag — independently consumes from that same topic. decoupled. extensible. if tomorrow you want to add a "trending" service, just add another consumer. zero changes to the post service.
so kafka is not something we added for fun — it naturally falls out of the requirement that multiple services need to react to a post being published. the hashtag worker (wrkr = worker, another shorthand) is just one of many consumers on that topic.
now the hashtag worker receives the event, gets the post ID, fetches the caption from the post service (or the caption is included in the kafka event itself), and extracts hashtags from it using a simple regex. the naive implementation looks like this:
def process(m):
    tags = extract_hashtags(m.caption)
    for tag in tags:
        db.incr(tag, 1)
simple. one db call per tag. but let's estimate the scale. if instagram sees 100K posts per minute, and each post has ~8 hashtags on average, that's 800K database updates per minute just for this one use case. one db call per tag is not gonna cut it.
✽ RECALL when a post is published, why shouldn't the post service just call the hashtag service directly?
because hashtag isn't the only listener — feed, notifications, and search all care about the same event. direct calls couple the post service to every downstream: adding a consumer means modifying it, a slow consumer slows publishing, a dead one forces per-consumer retry logic. instead it publishes one POST_PUBLISH event to a kafka topic and moves on; consumers subscribe independently, and adding a "trending" service tomorrow touches nothing upstream. kafka falls out of the requirement — it isn't bolted on for fun.
approach 2: in-memory batching
so we buffer. instead of writing every increment to the db immediately, we accumulate counts in an in-memory map and flush periodically.
def process(m):
    tags = extract_hashtags(m.caption)
    for tag in tags:
        m[tag] += 1

    if has_been_long():   # > 5 minutes or count > 1000
        for tag, count in m:
            db.incr(tag, count)
        m.clear()
now instead of db.incr(tag, 1) eight hundred thousand times, you do db.incr(tag, count) where count could be hundreds or thousands. you've slashed the db calls by a massive factor.
but should you trigger the flush on time or frequency? time-based (every 5 minutes) has a risk — what if a surge of posts comes in and your map fills up so much that you run out of memory and the process crashes? frequency-based (every 1000 messages) is safer in that regard. pick based on your appetite for risk.
one small but crucial thing — write the buffer to disk instead of purely in-memory. if the worker crashes, in-memory data is gone. an embedded db like rocksdb or leveldb that supports incr operations gives you durability without much complexity.
✽ RECALL your hashtag counter is doing 800k db increments a minute. how do you slash that, and what are the two risks in the fix?
buffer counts in a map and flush periodically — one db.incr(tag, count) instead of count separate calls. risk one: a purely time-based flush can let the map grow unbounded during a surge and oom the process, so a count-based trigger is safer. risk two: in-memory data dies with the worker, so back the buffer with an embedded store like rocksdb that supports incr — durability without much complexity.
the stop-the-world problem
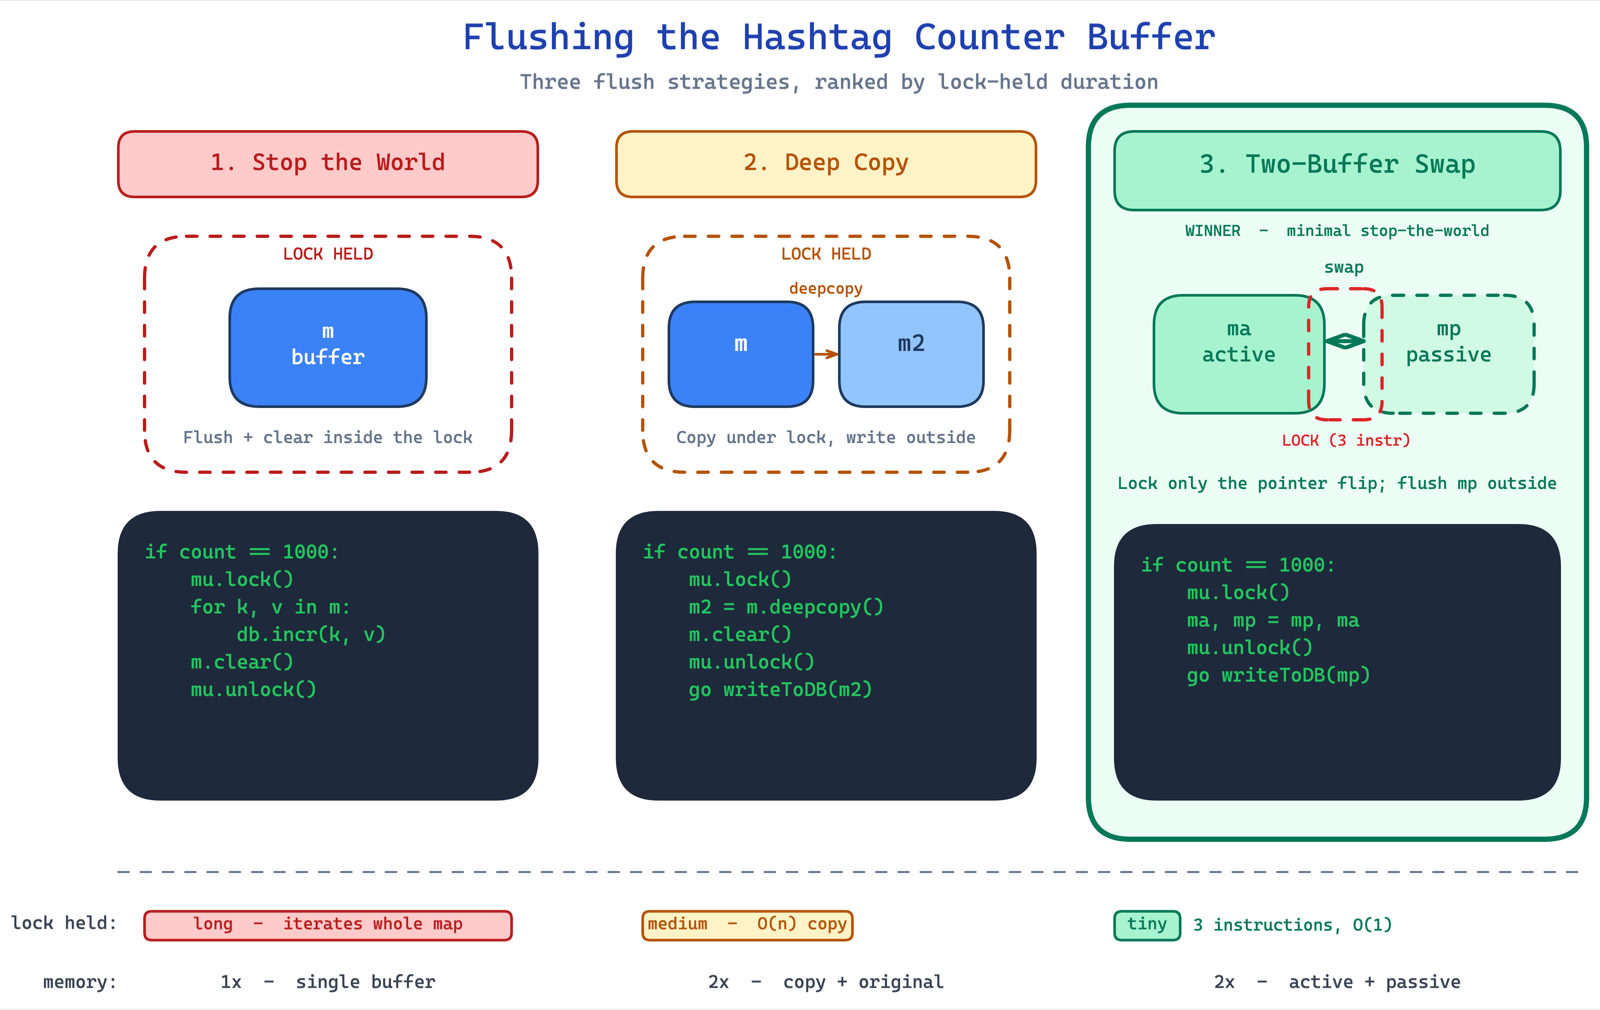
here's where it gets really interesting. when you flush the buffer, you're iterating through the map and making sequential db calls. during this time, you've stopped consuming from kafka. if the flush takes 5 seconds (say 1000 tags × 5ms per call), that's 5 seconds of zero consumption. bad.
so you think — let me do this in a separate thread. but now the map is shared between two threads: the consumer thread (writing to the map) and the flusher thread (reading from it). if you try to iterate and modify the map simultaneously, you get concurrent modification exceptions. if you take a lock, you're back to stopping the world.
deep copy approach: take a lock, deep copy the map, clear the original, release the lock, then flush the copy in a thread. the critical section is now just the deep copy + clear, not the entire flush. much better. but deep copy takes time and doubles your memory.
the two-buffer swap — minimal stop the world:
this is the elegant solution. think of it like a mcdonald's coke fountain competition — you have two glasses. while you're drinking from one, you fill the other. apply this to buffers.
you always write to the active buffer. when it's time to flush, you swap references — ma, mp = mp, ma. that's it. three CPU instructions. your critical section is literally a variable swap. no deep copy, no doubled memory, no long lock times.
if count == 1000:
    mu.lock()
        ma, mp = mp, ma
    mu.unlock()
    go writeToDB(mp)
the flusher thread works on the passive buffer at its own pace while the consumer keeps writing to the now-active buffer. when the flush is done, swap again. this is the same pattern used in production systems handling petabytes of data — google's dataproc remote shuffle service used exactly this to avoid stopping consumption while writing to remote storage.
✽ RECALL flushing the buffer inline stops kafka consumption, a flusher thread causes concurrent modification, and locking the map stops the world again. how does the two-buffer swap escape all three?
keep an active and a passive buffer. the consumer always writes to active; at flush time you take the lock only to swap the two references — three cpu instructions — then a background thread drains the passive buffer at its own pace while consumption continues uninterrupted. no deep copy, no doubled memory, a near-zero critical section. same pattern google's dataproc shuffle service used at petabyte scale.
approach 3: repartitioning by hashtag
one more thing. the kafka topic POST_PUBLISH is partitioned by post ID. so two posts containing #sunset could end up on two different worker machines. each does incr(sunset, 1) independently instead of one doing incr(sunset, 2). not the absolute minimum db calls.
if you want to minimize further, you write an adapter that reads from POST_PUBLISH, extracts hashtags, and writes to a new kafka topic POST_HASHTAG partitioned by hashtag. now all #sunset events land on the same consumer. your batching is maximally efficient.
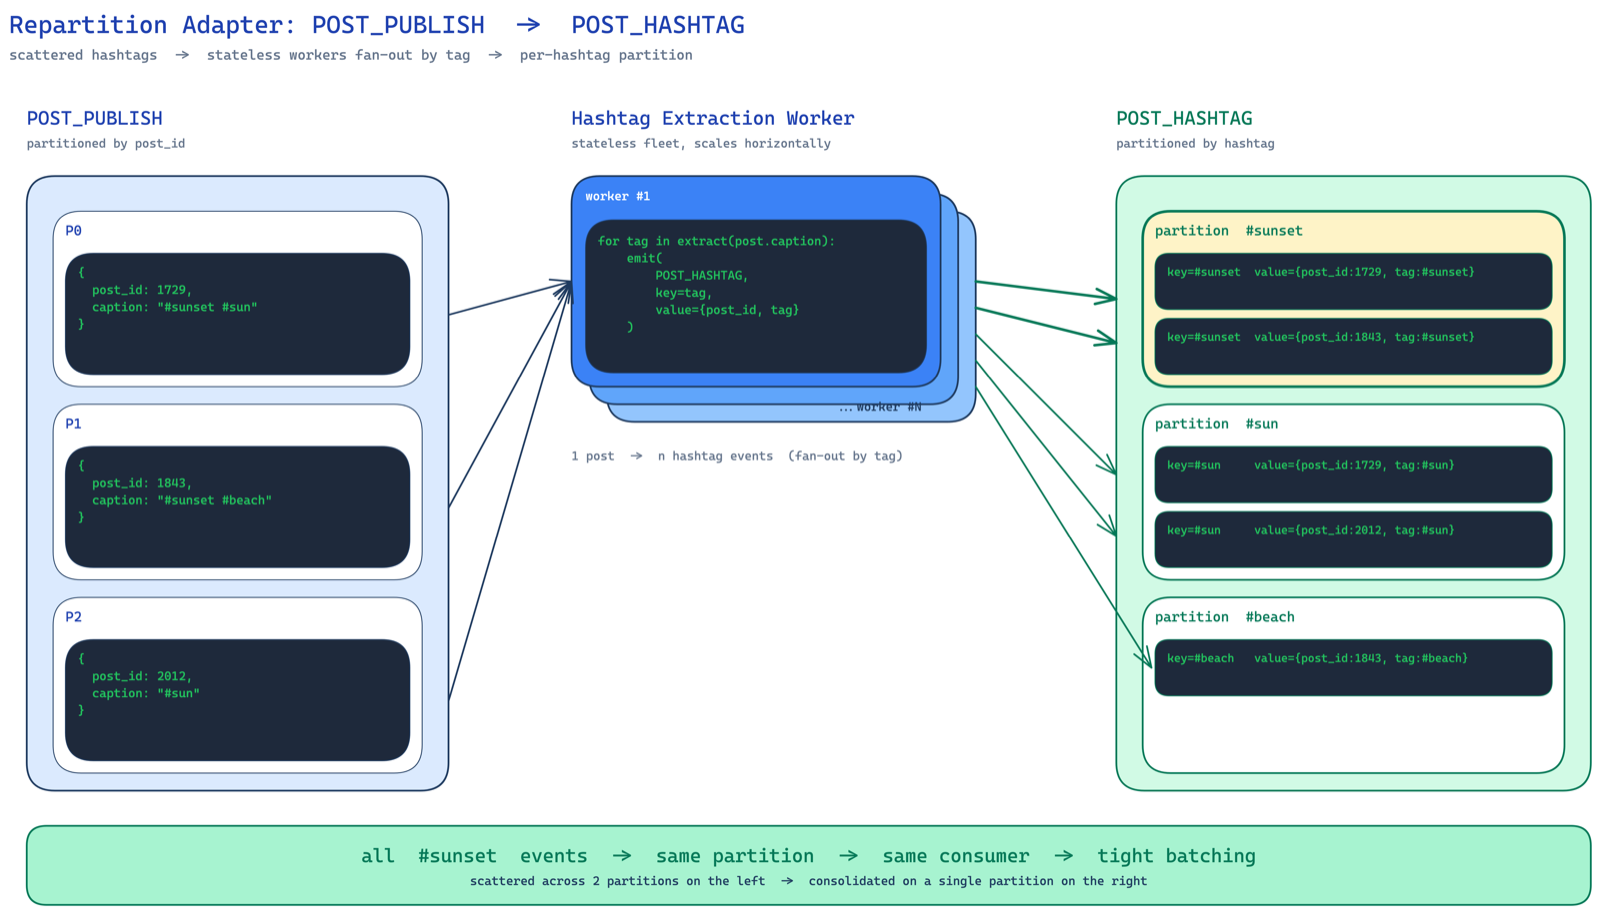
but — this adds another kafka topic, more infra to manage, more cost. the benefit should outweigh the operational complexity. for most cases, the two-buffer batching approach is good enough. don't over-engineer.
read path optimization: CDN
one last thing on the read side. for a given hashtag, the count doesn't change every second. the top 100 photos don't rotate every minute. this data is relatively stable. perfect candidate for a CDN. stick a CDN in front of your hashtag API, set a reasonable TTL, and most requests never even hit your backend.
since the hashtag page has no personalization — #sunset looks the same for everyone — there's no reason not to cache it on CDN. anything on CDN, assume it's public.
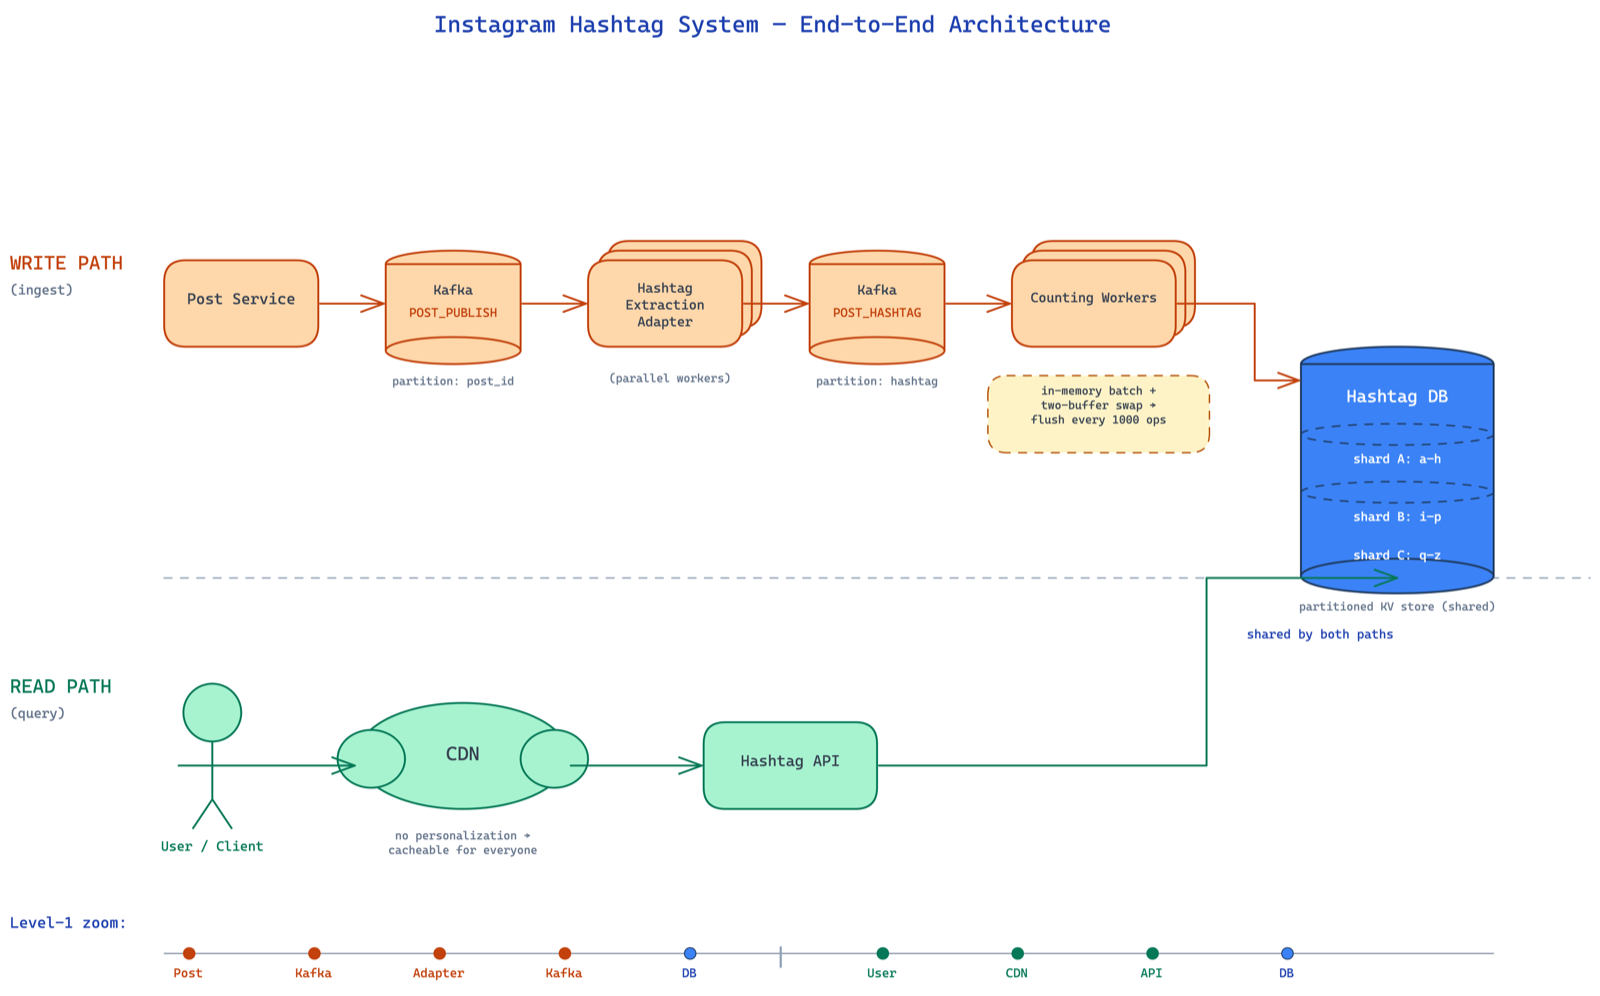
the full picture
zooming out — you can see how every piece slots together. post service publishes events, an adapter repartitions them by hashtag, counting workers batch and update the partitioned db, the hashtag API reads behind a CDN. read path and write path optimized independently.
key takeaways
- kafka as a glue binding services together. post service publishes, hashtag workers consume, feed/notification/search services also consume.
- adapter pattern for repartitioning — if you're unhappy with the partition key, write a relay agent that reads and repartitions.
- read path vs write path — separate them, optimize them independently. reads get replicas, caches, CDNs. writes get batching, buffering, partitioning.
- wear three hats — architect, product manager, engineer. a senior engineer proposes product changes that simplify the system.
and the most important takeaway? don't skip steps. don't jump to the complex solution because it sounds impressive. start simple. measure. find the actual bottleneck. then optimize. most people love being at the peak of the complexity curve. but just one extra push of thinking can simplify your solution dramatically.